A Deep Dive into a Production OOMKilled Alert: The Full Story from JVM Memory to a Code Vulnerability
"In the complex world of distributed systems, every seemingly harmless alert can be a thread leading to the core of a problem."
Introduction: A New Challenge
A few months ago, driven by a passion for backend engineering, I joined my company's chatbot team to work on a Java project called bot-gateway. Interestingly, our service had been unstable for months, with Kubernetes Pods restarting intermittently every day. However, due to a busy feature development schedule, the issue was consistently postponed. What was even more interesting was that, as a newcomer to Java, after two months of shipping business features, I finally had the chance to join an "Engineering Excellence Sprint." Fueled by curiosity and a love for solving technical puzzles, I volunteered to take a deep dive into this problem.
The investigation was challenging, but the final outcome was incredibly satisfying. I can say that this journey took me through everything from business code to the JVM memory model, from K8s pod management to live production monitoring. I'm writing down the entire process here to share it with you all.
Part I: The Abrupt Pod Restarts
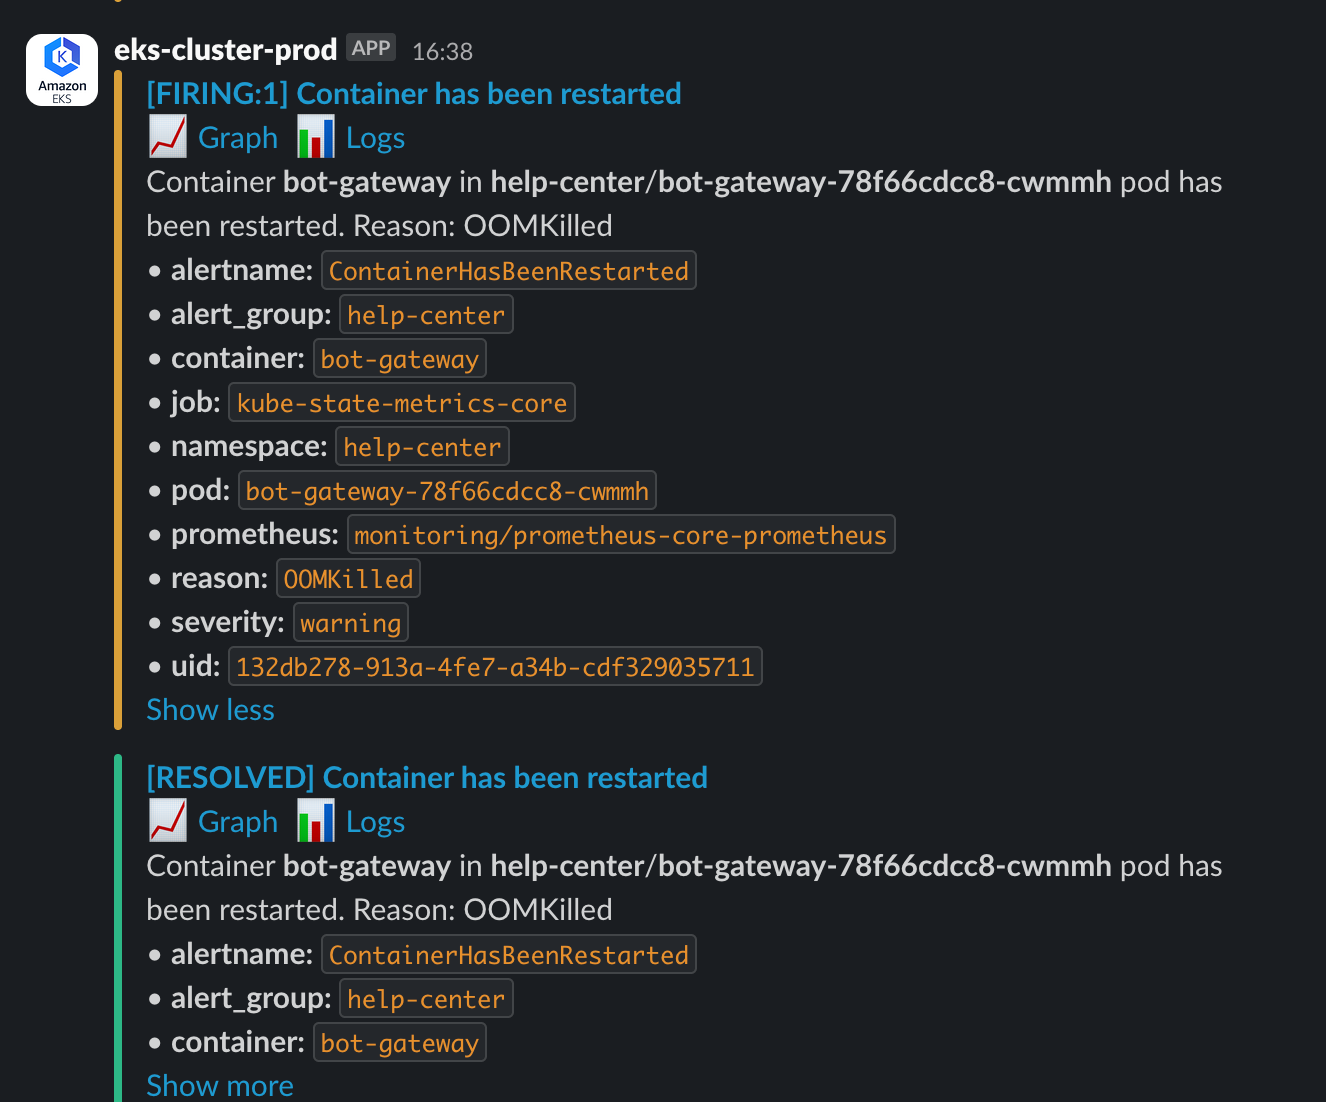
It all began on a seemingly calm night when our alerting system was suddenly triggered:
[FIRING:1] Container has been restarted. Reason: OOMKilled
This alert came from one of our core services, bot-gateway.
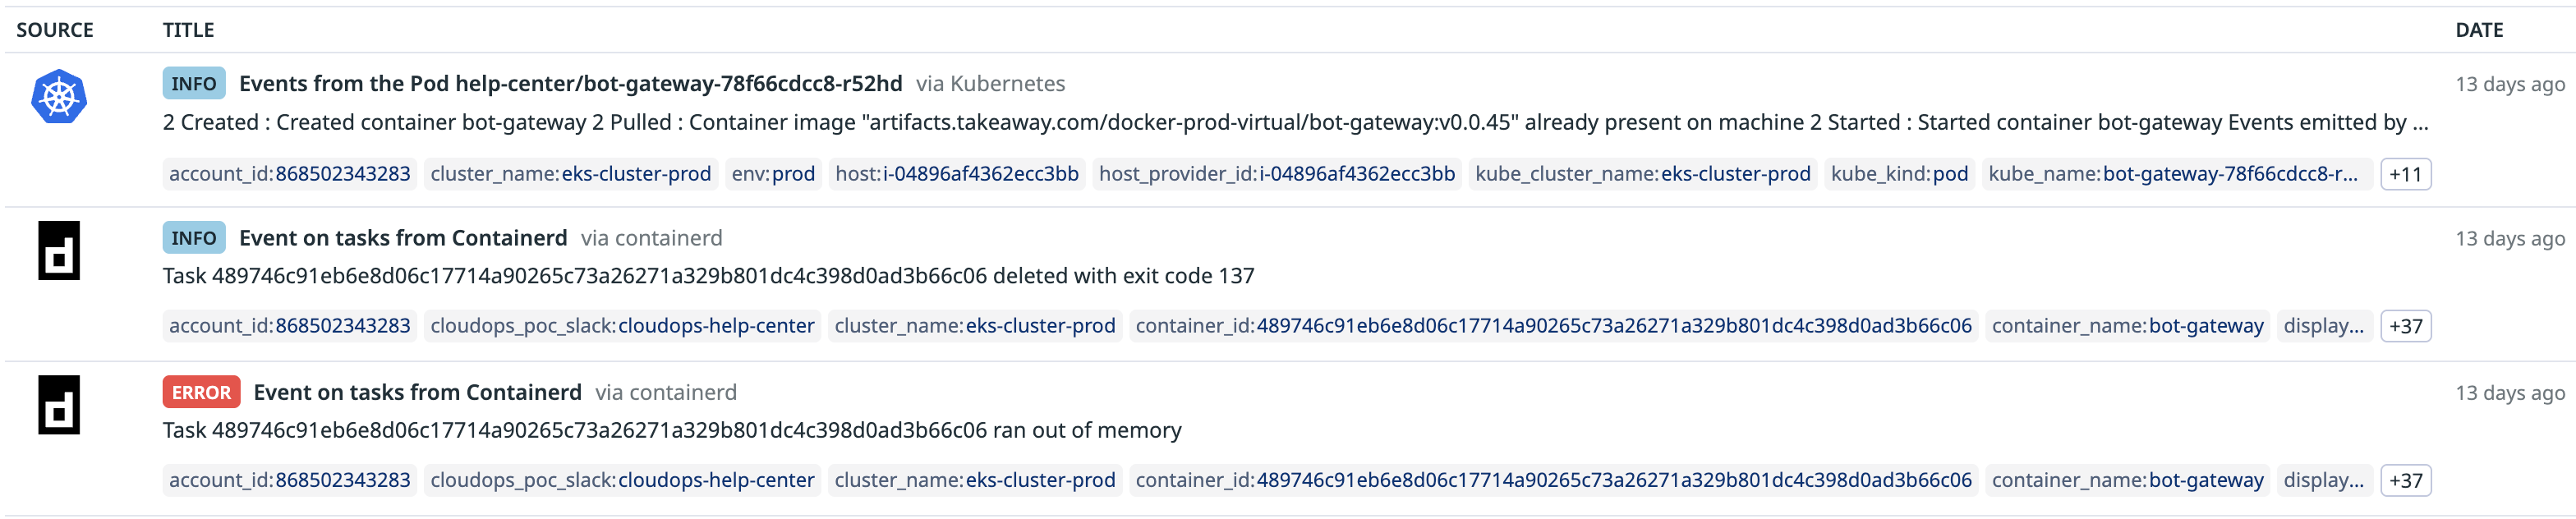
The term OOMKilled spells trouble for any SRE or developer. After some research, I understood it meant a container was ruthlessly terminated by its host (a Kubernetes node) for running out of memory. What was more frustrating was how sudden and violent it was. The application layer had no time to leave any meaningful "last words"—no application logs, and only a cryptic message in the container logs:
Task ... ran out of memory
... deleted with exit code 137
exit code 137 signifies that the process was terminated by a SIGKILL signal.
The service was restarting again and again, impacting user experience and putting immense pressure on the team. And so, my deep-dive investigation began.
Part II: Laying the Theoretical Groundwork
I wasn't deeply familiar with the JVM before this, so this was a perfect opportunity to solidify my foundational knowledge.
Distinguishing between these two core concepts was crucial:
OOMKilled vs java.lang.OutOfMemoryError
OutOfMemoryError(OOM Error): This is the JVM's "internal conflict." The JVM realizes its own Heap Memory is exhausted and proactively throws an exception. It's a relatively "graceful" way to fail.OOMKilled: This is the container's "external conflict." Kubernetes detects that the total memory footprint of the container (Heap + Non-Heap + Native Memory, etc.) has exceeded its configured limit (limits.memory). To protect the stability of the entire node, the OS acts like an unforgiving city warden, forcibly evicting the rogue process.
A Brief on the JVM Memory Model
- Heap Memory: Stores all object instances created with
new. It's divided into a Young Generation and an Old Generation. Objects are born in the Young Gen and are promoted to the Old Gen if they survive multiple Garbage Collection (GC) cycles. A continuously growing Old Gen usually indicates a memory leak. - Non-Heap Memory: In Java 8+, this primarily refers to Metaspace, which stores class definitions, methods, and other metadata. A continuously growing Metaspace often signals a ClassLoader Leak.
- (TODO: Link to a separate JVM memory blog)
Of course, at the beginning, I had no idea whether this was a container configuration issue (e.g., the app just needed more than the 1GB of memory it was allocated) or a bug in our application code. I had no choice but to start wading through the water.
Part III: The Detective Work
After consulting with various AI teachers (ChatGPT, Gemini, DeepSeek), I devised a plan: analyze monitoring metrics, inspect a memory snapshot (Heap Dump), and trace error logs.
1. The Abnormal ECG on the Metrics Dashboard
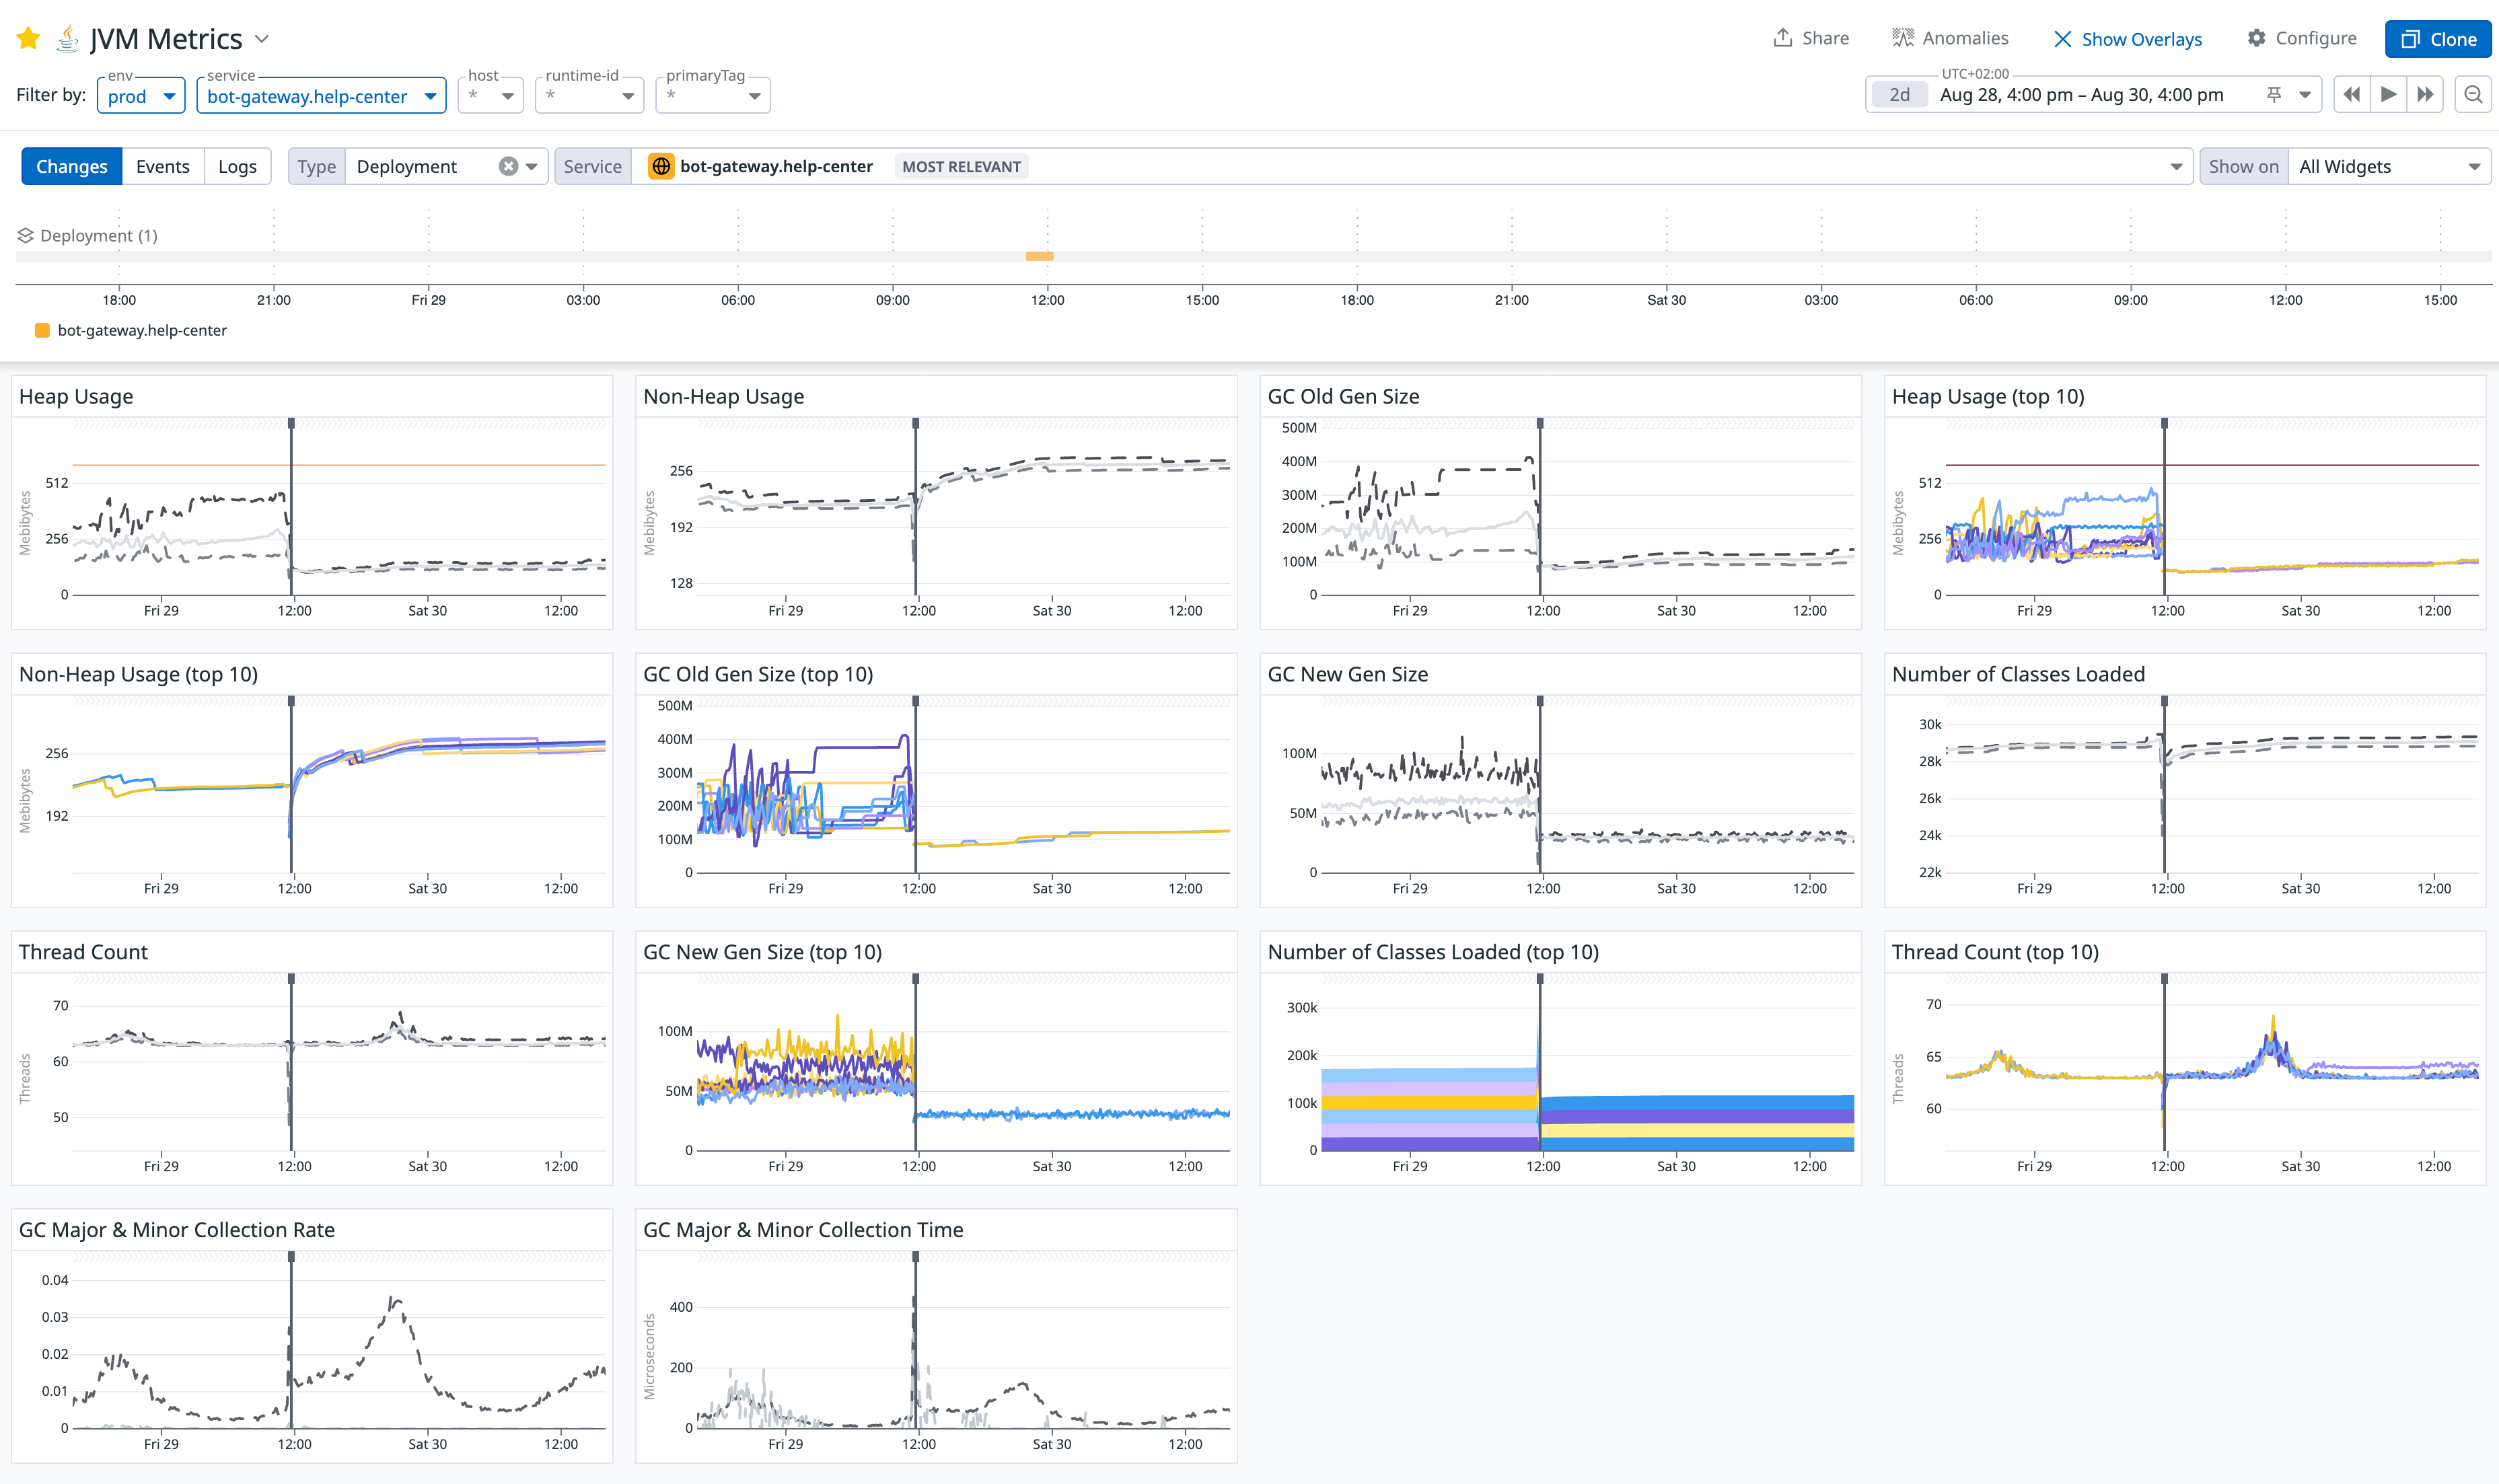
First, I opened our JVM Metrics dashboard. The chart before the fix was shocking:
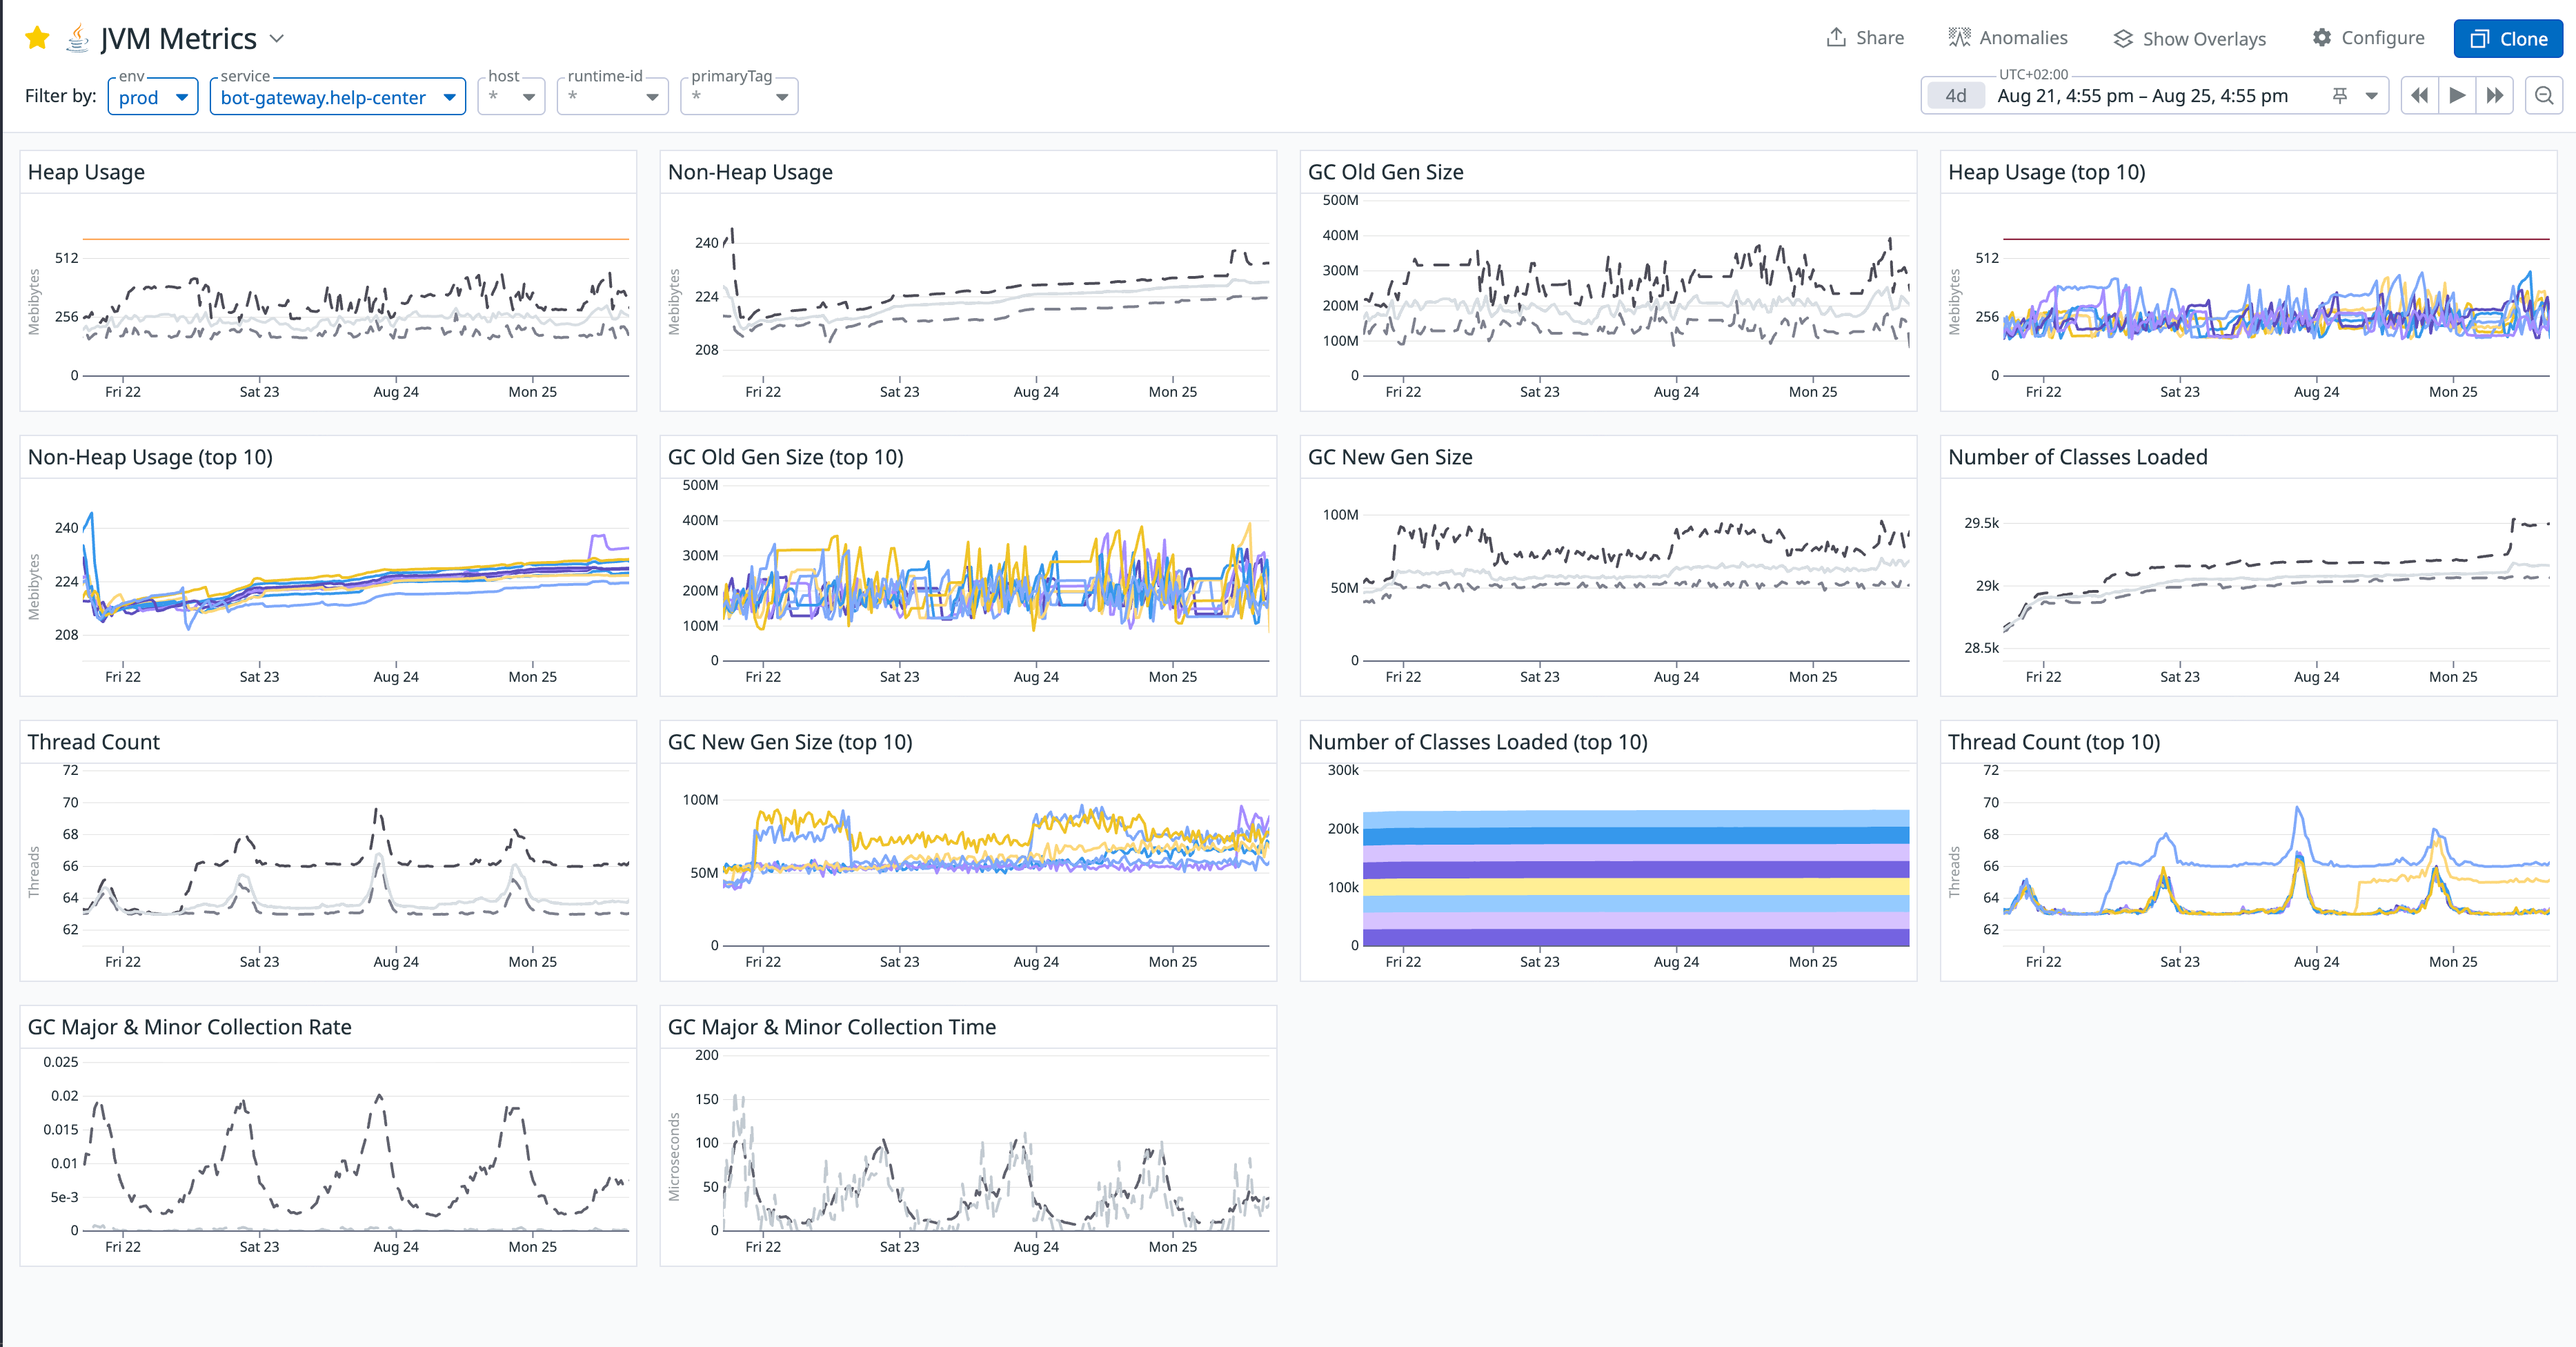
The most glaring anomaly was the GC Old Gen Size chart. It clearly showed the memory usage of the Old Generation on a relentless, upward climb that never decreased. This strongly suggested that a large number of objects were being improperly held long-term and couldn't be collected by GC. The heap usage consistently stayed around 500MB, which seemed odd for a stateless gateway service that keeps most of its data in a Redis cache.
2. The "Crime Scene" Inside the Heap Dump
To unmask these "deadbeat" objects, we needed a heap dump. At the same time, to prevent the pod from being killed directly by the container and instead have the application throw a more gentle OutOfMemoryError, I tried adding various JVM flags—a bit of JVM tuning:
<jvmFlags>
    <jvmFlag>-server</jvmFlag>
    <jvmFlag>-XX:MinRAMPercentage=40</jvmFlag>
    <jvmFlag>-XX:MaxRAMPercentage=60</jvmFlag>
    <jvmFlag>-XX:MaxDirectMemorySize=192m</jvmFlag>
    <jvmFlag>-Xss512k</jvmFlag>
    <jvmFlag>-XX:NativeMemoryTracking=summary</jvmFlag>
    <jvmFlag>-XX:+UnlockDiagnosticVMOptions</jvmFlag>
    <jvmFlag>-XX:+HeapDumpOnOutOfMemoryError</jvmFlag>
    <jvmFlag>-XX:HeapDumpPath=/dumps</jvmFlag>
    <jvmFlag>-Dio.netty.leakDetection.level=PARANOID</jvmFlag>
    <jvmFlag>-javaagent:/library/dd-java-agent.jar</jvmFlag>
    <jvmFlag>-Ddd.jmxfetch.enabled=true</jvmFlag>
    <jvmFlag>-Ddd.jmxfetch.statsd.enabled=true</jvmFlag>
</jvmFlags>
The purpose of these flags included:
- Limiting the JVM memory range so it would throw an
OutOfMemoryErrorexception when exhausted, preserving the crime scene's stack trace. - Setting the thread stack size to 512k (since we don't have overly complex logic).
- Capping Direct Memory at 192M.
- Enabling Native Memory Tracking to analyze it with
jcmd diff. - Configuring
HeapDumpOnOutOfMemoryErrorto save the heap dump to a K8s container volume. - Enabling the Datadog agent's jmxfetch.
We captured a heap snapshot (.hprof file) via the Spring Actuator /heapdump endpoint. A little side story here: I used to have exec access to K8s pods, which made it easy to shell in, run JDK commands, and download dumps. However, for security reasons, the SRE team had recently revoked this permission, leaving kubectl debug as the only option. So, I had to pick a pod that looked like it was on the verge of crashing, use kubectl to forward its port 8080 to my local machine, and then hit localhost:8080/heapdump to download the file.
Opening it with the Memory Analyzer Tool (MAT) was revealing: .
-
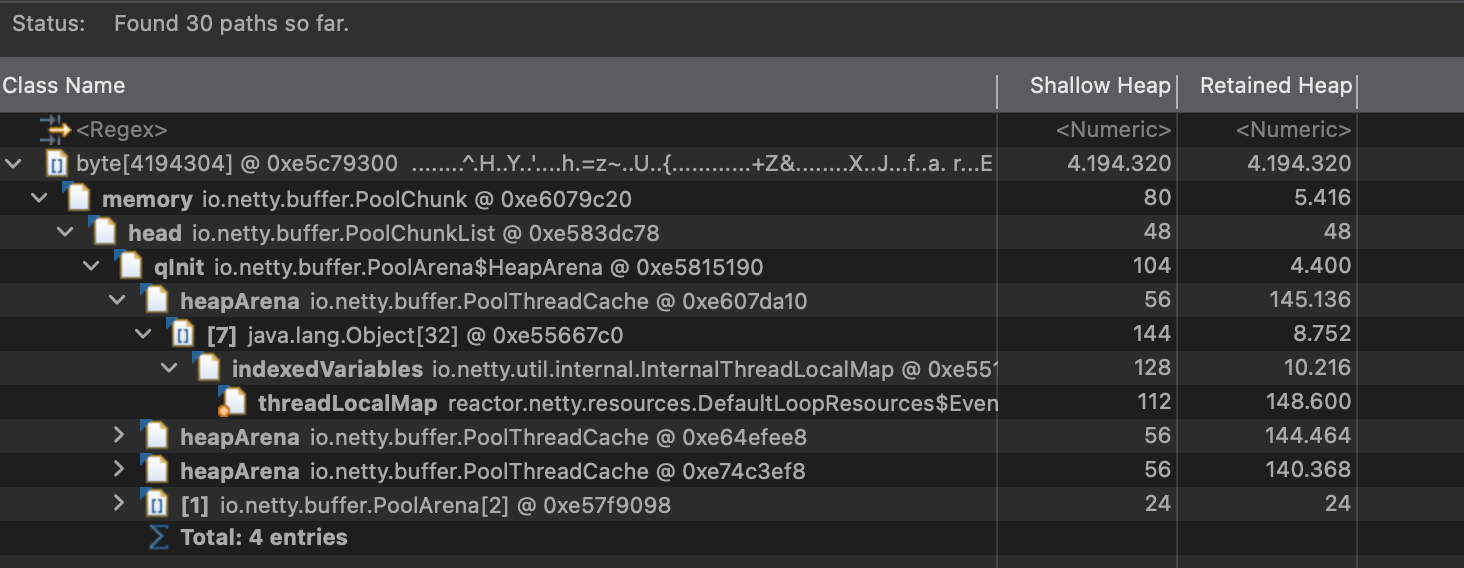
Suspect A: Giant
byte[]Arrays & Netty TheDominator Treeview showed several abnormally largebyte[]arrays. Tracing their references viaPath to GC Roots, we found they all pointed back toreactor.netty's memory pool components (PoolChunk). This led us to initially suspect a Netty buffer leak, prompting the addition of theDio.netty.leakDetection.level=PARANOIDJVM flag to catch any unreleased memory allocations in the logs.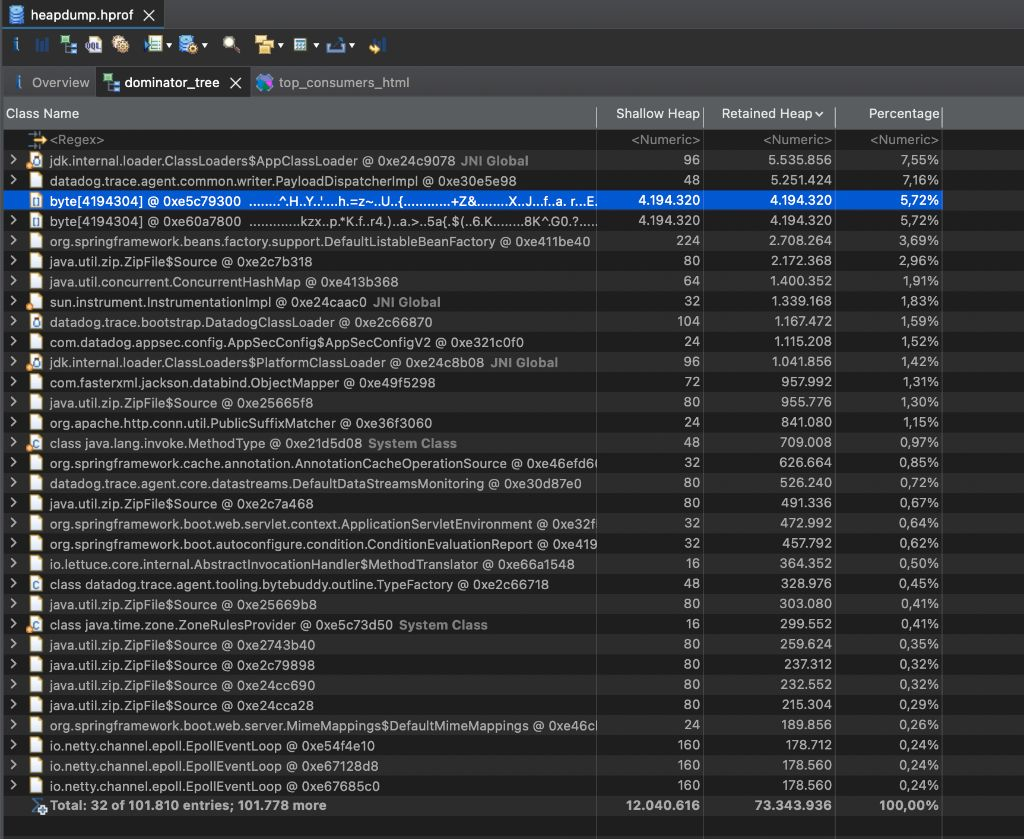
-
Suspect B: The Peculiar
DatadogClassLoaderTheLeak Suspectsreport pointed to another problem: a large number ofjava.util.zip.ZipFile$Source(open JAR file handles) andjava.lang.Classobjects were being held by a classloader namedDatadogClassLoader. This not only explained why our Non-Heap memory was slowly growing but also uncovered a chronic resource leak caused by our monitoring agent.
3. The Decisive Error Log (The Smoking Gun)
With the JVM flags configured, I started monitoring. A day and night passed with no specific logs, but I noticed the pod restart frequency had significantly decreased. Just as I was feeling lost, I tried to dump another heap profile via the Spring Actuator endpoint. As luck would have it, the pod must have been truly on the edge this time. The endpoint returned a 500 error, with the reason being java.lang.OutOfMemoryError: Java heap space.
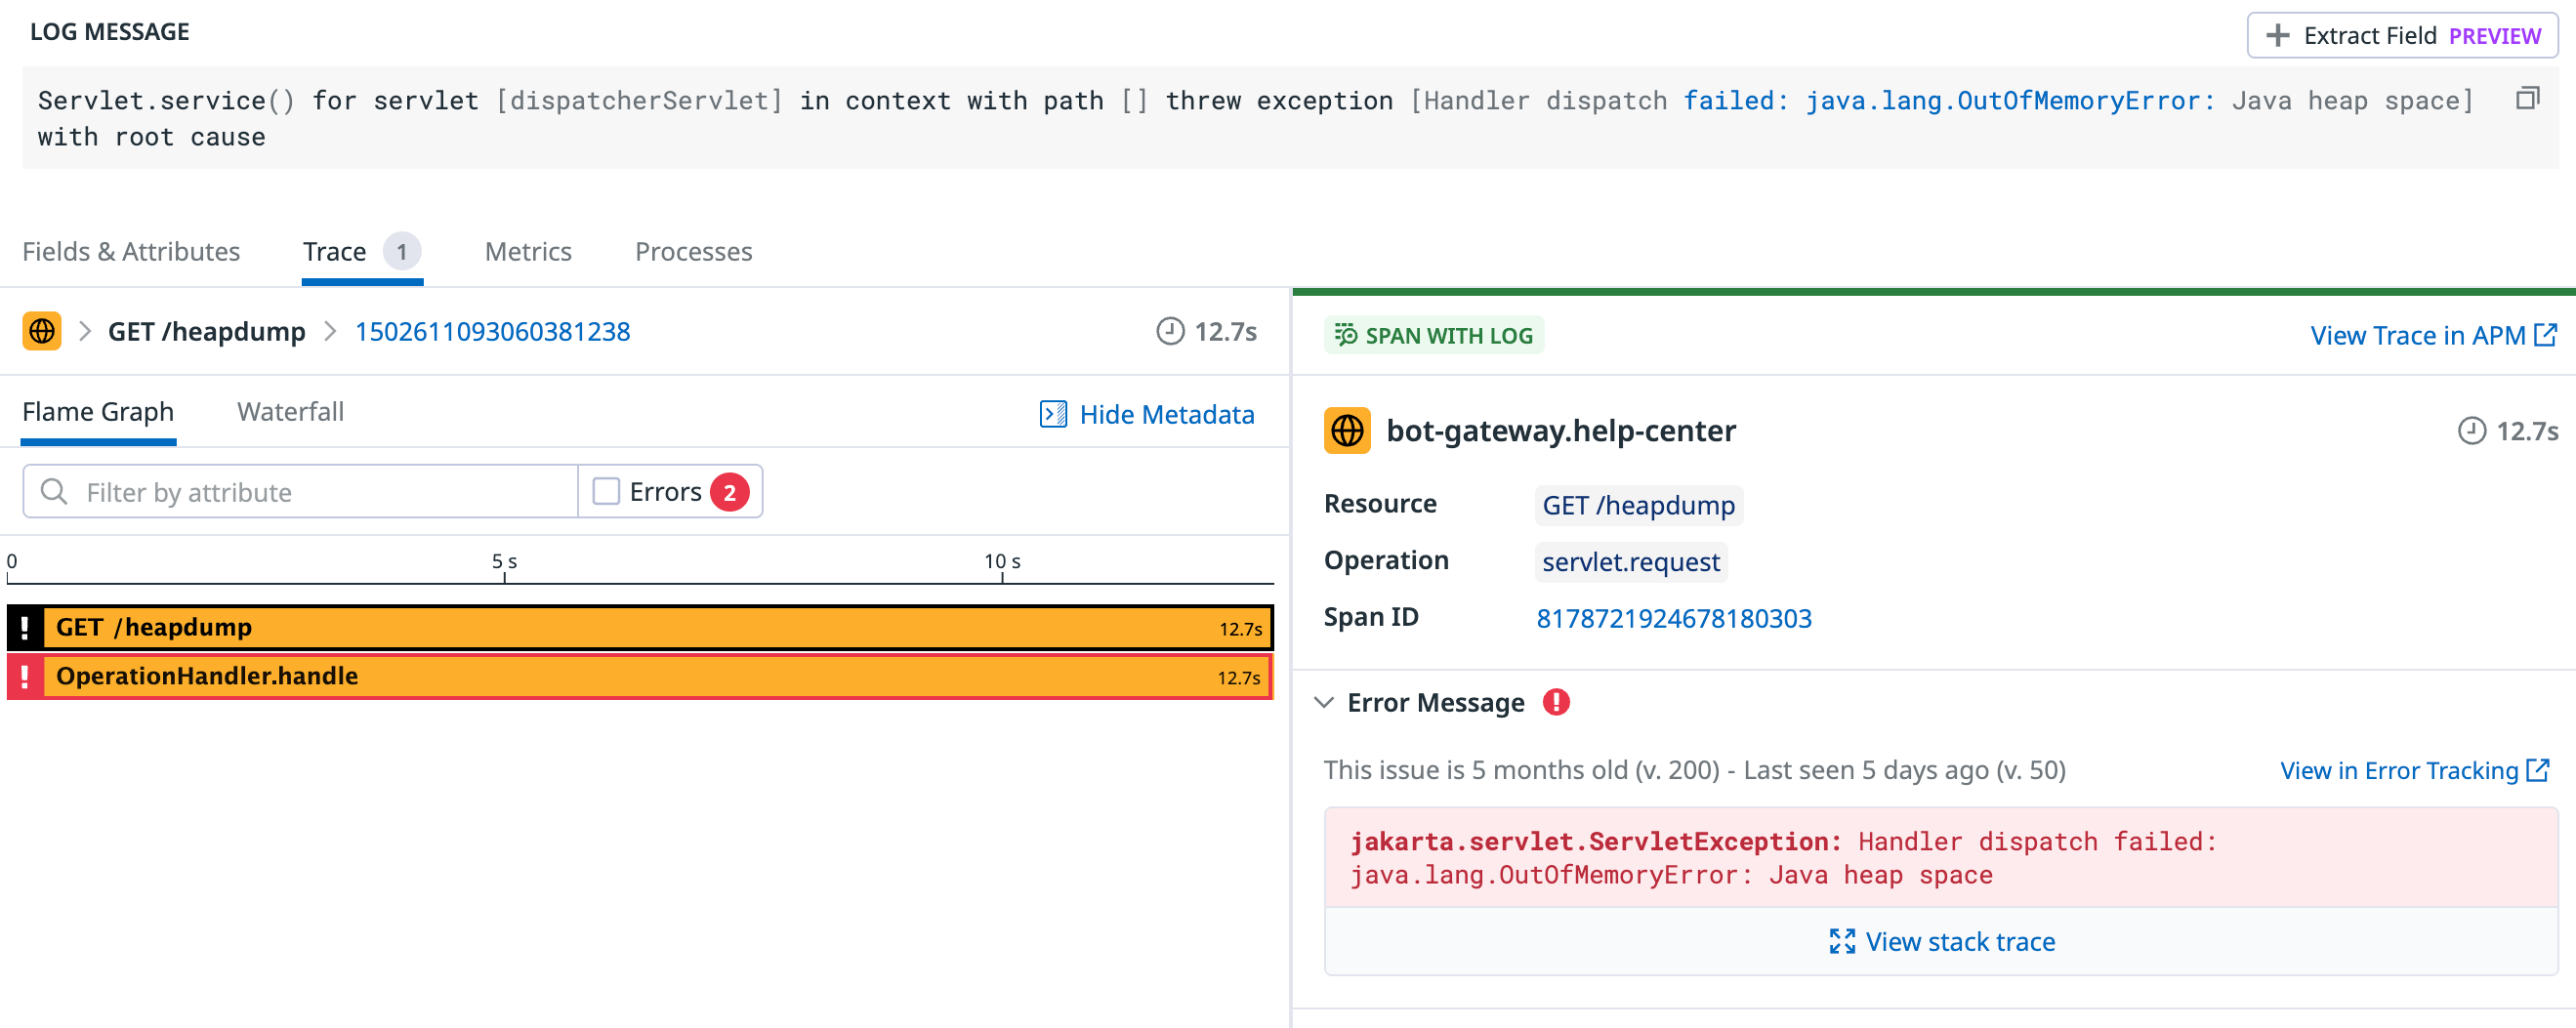
This was interesting. So it could throw an OutOfMemoryError after all. I immediately broadened my log search for "java.lang.OutOfMemoryError" and, to my surprise, found several instances buried in a pile of error logs. Aside from the one triggered by the /heapdump endpoint, all the others came from another piece of logic:
An internal JVM OOM Error:
java.lang.OutOfMemoryError: Java heap space
    at java.desktop/java.awt.image.DataBufferByte.<init>(DataBufferByte.java:93)
    ...
    at javax.imageio.ImageIO.read(ImageIO.java:1466)
    ...
    at com.justeattakeaway.botgateway.service.evidence.validators.impl.ImageValidator.readImage(ImageValidator.java:75)
The case was cracked! This stack trace was a beam of light that illuminated the entire problem. The error was happening in our ImageValidator service! I quickly reviewed the code. We have a feature that allows users to upload images of food-related issues for customer service. During the upload, the backend performs validation (e.g., image dimensions, file size, format), which relies on ImageValidator. Internally, it was calling ImageIO.read(), a method that loads the entire, uncompressed pixel data of the image into heap memory.
This meant we were holding the complete user-uploaded image in memory, which is incredibly resource-intensive over time. These large objects couldn't be GC'd and became "tenants for life" in the Old Gen. An even more severe security risk was that a malicious user could upload an "image bomb"—a file that is small in size but has an extremely high resolution—to instantly exhaust all memory. For example, a 20,000x20,000 pixel image requires about 1.6 GB of heap space! This was a critical code vulnerability.
Part IV: The Fix
We now had a complete picture of the problem:
- Chronic Illness: A ClassLoader leak from the Datadog Agent was slowly raising the Non-Heap memory baseline.
- Complication: A potential buffer leak in Netty was adding pressure to the Heap.
- The Trigger: The dangerous image handling logic in
ImageValidatorwas the final straw that broke the camel's back.
Our solution had to be a targeted, three-pronged attack:
- The Critical Patch (The Cure): Refactor
ImageValidator. We abandoned the direct call toImageIO.read()and switched to the saferImageReaderAPI to read the image's dimensions (metadata) before fully decoding it. If the dimensions exceeded a preset safety threshold, the image was rejected immediately. - Process Re-engineering (Strengthening the Foundation): We refactored the entire file-handling flow from a
byte[]based approach to anInputStreambased, streaming approach, reading data in 8KB chunks. From the source, if the size exceeded the limit, the image was rejected, avoiding the problem of loading large files into memory all at once. - Long-term Governance (Eradicating the Disease): We identified our Datadog Java Tracer version (
1.39.0) and planned an upgrade. Upgrading to the latest version would resolve the known ClassLoader leak and other minor logging errors simultaneously.
Part V: Calm After the Storm
After deploying the fix, the results were immediate and dramatic. The JVM Metrics dashboard showed an unprecedented level of stability:
- Heap Usage no longer had fatal spikes and settled into a healthy, periodic pattern, dropping from 500MB to a stable 150MB.
- Old Gen Size stopped its relentless growth, stabilizing at a reasonable 100MB (down from 400MB).
- New Gen Size dropped from 90MB to 30MB.
- The
OOMKilledalerts fell silent.
Final Chapter: Lessons and Reflections
This thrilling investigation (during which my carefully configured JVM flags were rolled back multiple times due to other production incidents) left us with invaluable lessons:
- Everything is Connected: Complex production issues are often the result of multiple, seemingly unrelated factors (application vulnerabilities, dependency leaks, framework usage) compounding each other.
- Theory Guides Practice: A deep understanding of foundational knowledge like the JVM memory model is the key to correctly interpreting monitoring data and memory snapshots.
- Tools are a Detective's Eyes: Proficiency with monitoring systems (Metrics), memory analyzers (MAT), and built-in diagnostic tools is fundamental to efficient problem-solving.
- Defensive Programming: Never trust user input. Implementing strict, memory-safe validation for untrusted data (like uploaded files) is a lifeline for system robustness.
This experience not only solved a tricky production issue but also deepened my understanding of the JVM, containerization, and distributed systems. Every production problem is a precious learning opportunity. It's through these challenges that we grow into better engineers—better Builders, Solvers, and Collaborators.